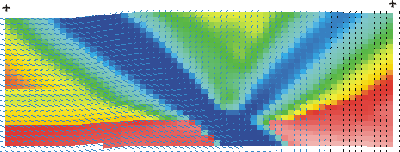

a) Second Invariant Deviatoric Strain Rate (high-to-low corresponds to blue-to-red) and Velocity vectors of crust above incipient subduction zone.

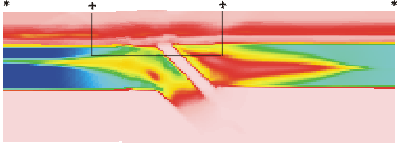
b) Second Invariant Deviatoric Stress (high-to-low corresponds to blue-to-red) of lithosphere in the vicinity of the incipient subduction zone.

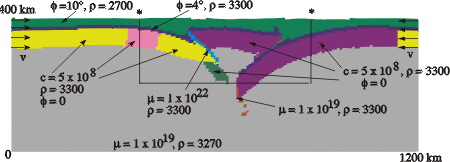
c) Model geometry and rheological properties of crust (green upper layer), `fluid' mantle (grey) and mantle lithosphere (other colours). Weak zone in lithosphere is blue. All units SI. phi = Coulomb internal angle of friction, c = cohesion, rho = density, µ = viscosity.
Figure 3: High resolution (201 x 601 Eulerian grid) `subduction' model. Figure shows initial responseto lithospheric input flux, v = 1 x 10⁻⁹ m/s (3.15 cm/yr), at left boundary. Left and right boundaries have small `leakage' flux to balance lithospheric influx. Model materials are very simple but the result demonstrates the capability to solve full density visco-plastic flows with a self-consistent treatment of the free surface. Note doubly-vergent nature of deformation above incipient subduction zone and reasonable resolution within the crust (panel a). Model is illustrative only and not intended to demonstrate the physics of subduction initiation.
Back to Lithoprobe Supporting Geoscience Proposal, November 1998